


Impact
How PHH’s Asset Managers See Every Operator in One Place
PHH’s asset managers used to log into nine systems to see their own portfolio. Now every operator shows up in one live dashboard, built on PHH’s Company Brain.

Zion Perets
Chief Real Estate Officer
Most asset managers can’t see their own portfolio without logging into someone else’s software. Every operator runs its own property management system and reports the same numbers its own way. By the time those reports are pulled together, the numbers are days old.
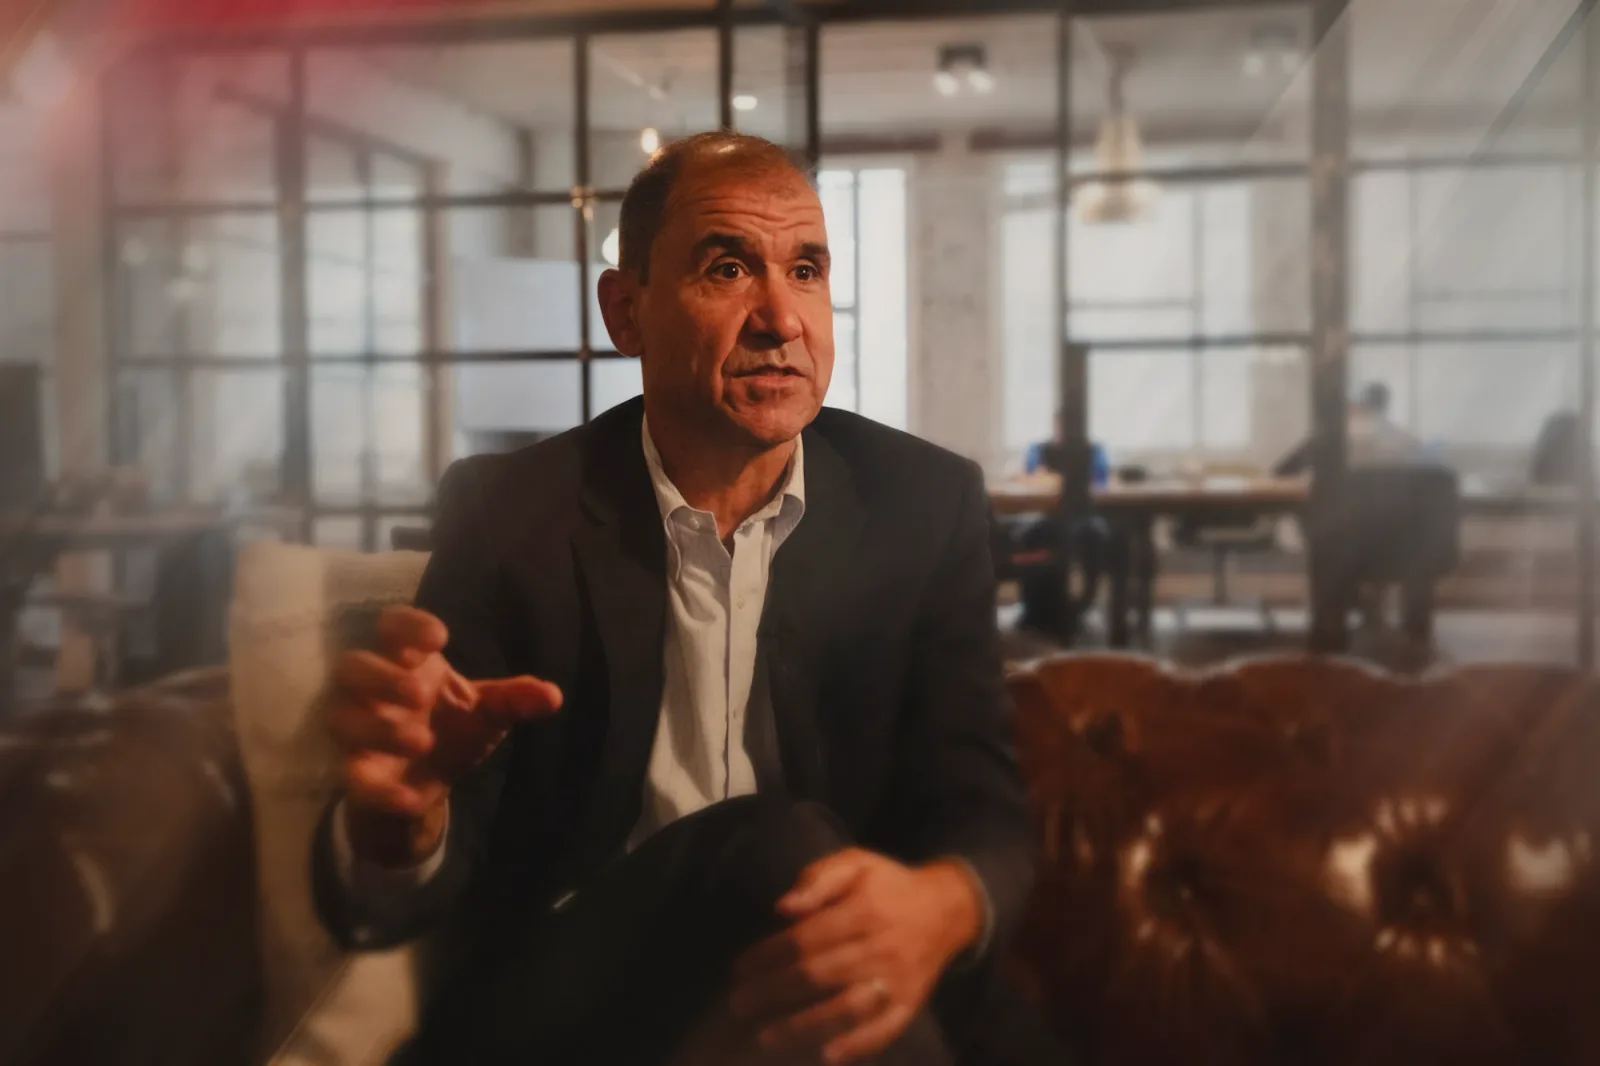
Peter Febo, US Head of Asset Management at Parks Hospitality Holdings (PHH), oversees more than 14,000 apartments run by four operating partners. Today his team sees every property, from every operator, in one live dashboard, structured the same way. None of his operators had to change the systems they run. Here’s how it happened, and what changed.
The short answer
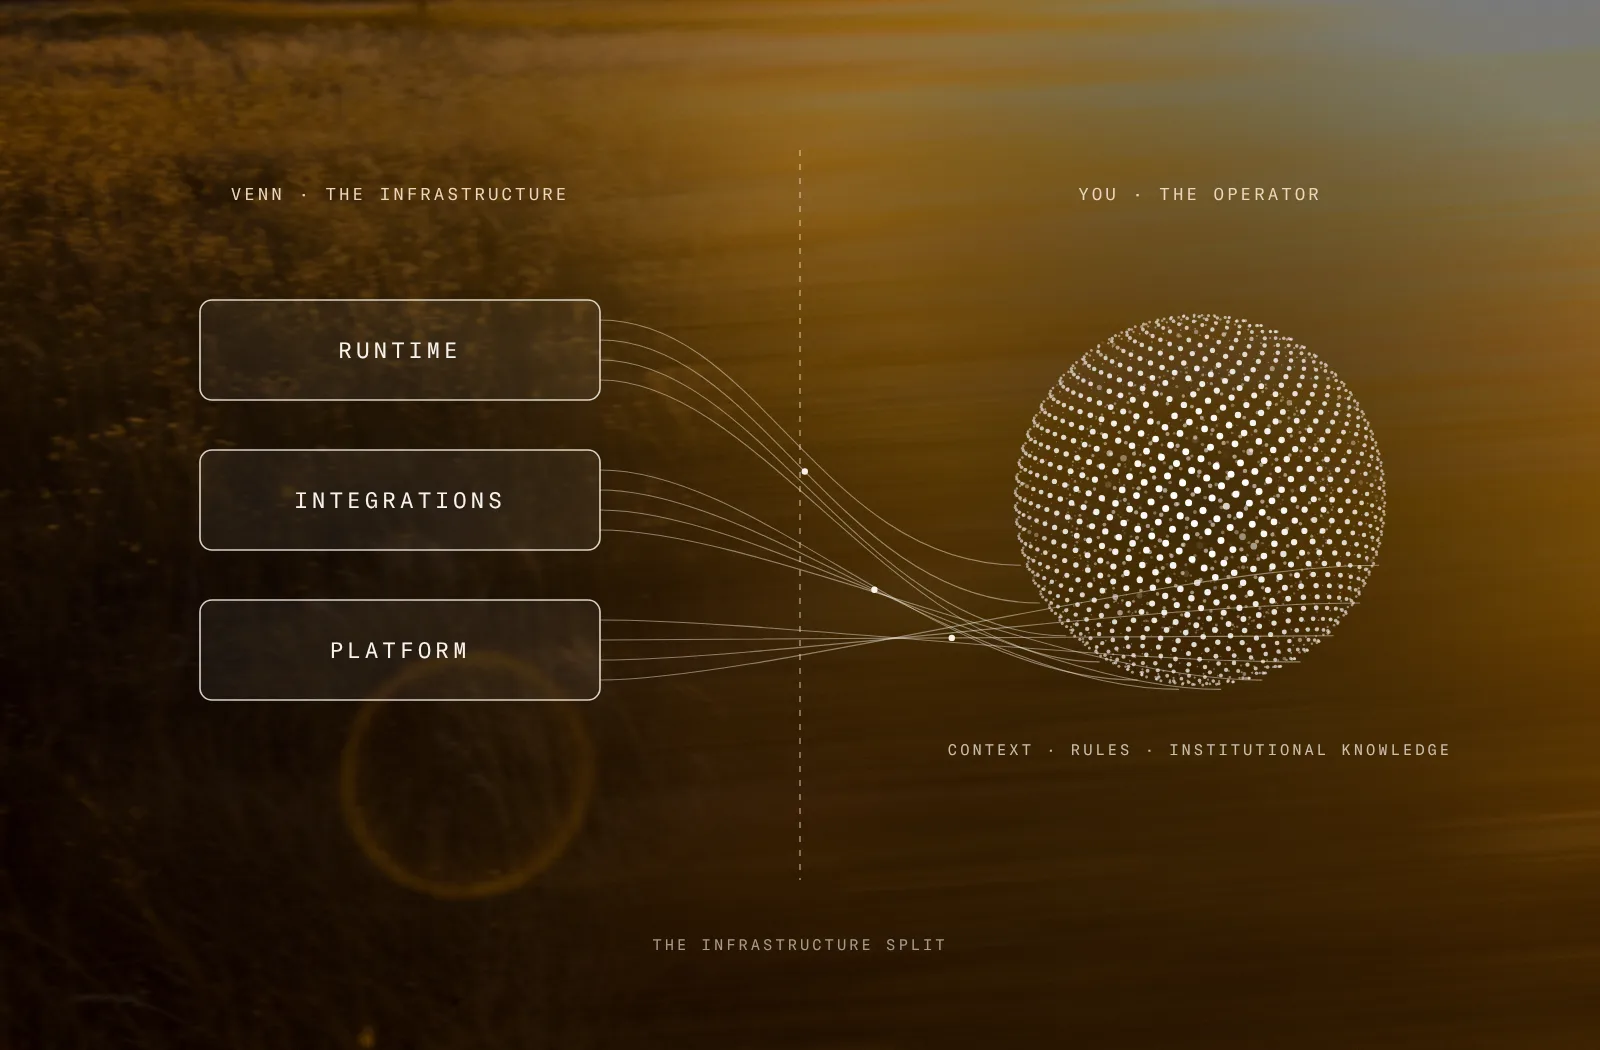
Asset managers get one view across multiple operators with their own Company Brain: a connected layer that sits on top of the systems each operator already uses, pulls their data together and organizes it the owner’s way. On top of it sits a real-time portfolio dashboard where every property reports the same way and anyone can ask a question in plain English.
PHH’s Company Brain is built on Venn. Peter had a first working dashboard for the PHH properties run by Kairoi Residential, one of his operators, a few days after his first call with Venn. Within 30 days, it was configured the way his team works, with the rest of his operators’ systems connected.
Why asset managers can’t see across their operators
Peter has spent about 30 years in real estate, more than 15 of them in the C-suite on the owner-operator side. He started as an accountant and an assistant property manager and worked his way up to COO and CEO. For years, he sent reports to his limited partners every Monday to keep them comfortable with the data. They still had questions every time.
Now he’s on the equity side, receiving the reports he used to send.
“I’m logging into nine different systems to figure out what is going on in my portfolio. Billions of dollars of real estate. I can’t see what’s going on unless I log into nine different systems.”
Peter Febo
US Head of Asset Management, PHH
- Nine logins. To look across his portfolio, Peter had to log into three different property management systems and two different CRMs.
- Reports that are already old. “We generate reports in Excel. By the time they get to my desk, they’re already a day stale.”
- Reports that don’t match. Every operator’s marketing report looked different. His analysts spent hours before the Friday and Monday portfolio roll-ups pulling it all together.
- Reports that are wrong. Automated reports from operators came in wrong often enough that his team had to validate them. “Now it’s Wednesday. I’m two days behind.”
Peter put it to a room of asset managers and operators at Venn’s New York office:
“Everyone in this room can’t tell me that the data is not already three days delayed by the time it gets to your hands. It is, every single time.”
Peter Febo
US Head of Asset Management, PHH
Two options, and why neither works
For two years, Peter tried to solve this at PHH. Every system looks so different that pulling the same data out of each one wastes a lot of time. “If I wanted to consistently look at my portfolio, if I have multiple operators, I can’t do it,” he said. That leaves owners with two choices.
Option 1: Log into all these systems and have your analysts pull it together. That’s where PHH was: an analyst team logging across multiple systems to pull the same data points, and reports that are already days old by the time they’re done.
Option 2: Buy the system and force all the operators to operate in it. “That’s what a lot of the larger firms are doing,” Peter said. “But what comes with that is now you have to be responsible for the data. You have to be responsible for the employees, the training. If the software goes down, you’re putting this onus on the owner that’s really an operator responsibility.”
It also makes it harder to change operators, and owners need that option. “They’re marriages,” Peter said. “Sometimes some are good, some are bad. You don’t want all your eggs in one basket.”
“That’s really the industry challenge: me having the ability to view my dashboard or understand my properties at a very detailed level without having to jump through hoops to get there.”
Peter Febo
US Head of Asset Management, PHH
What he wanted was a third way: one flexible system that sits over whatever each operator chooses to run.
“Bring any operator in, I want to see the same dashboard, the same data, apples to apples. Not only is it saving me time, but it allows me to manage the assets better.”
Peter Febo
US Head of Asset Management, PHH
Peter tried the big property management software companies. He ran one of their business intelligence dashboards for six months and canceled it, because the data wasn’t right. His team went back to Excel.
How PHH got there: the Company Brain was already in place
Peter didn’t come to Venn for a dashboard. Kairoi Residential, one of PHH’s operators, introduced him because Venn might know someone with a tool that could fix his problem.
What Venn realized on that call was that the hard part was already done. Kairoi runs on its own Company Brain built on Venn, so the data from PHH’s Kairoi properties was already connected and organized. Using the Company Brain’s roles and permissions, Venn separated out the data for Peter’s properties and built exactly what he described on top of it.
A few days later, instead of a referral, Peter got a login to a working dashboard for his Kairoi properties. Over the next 30 days, Venn configured it around how his team works and connected the rest of his operators’ systems.
“We knew what we needed to see every day,” Peter said. “Venn helped us frame it.” The team, which has real estate experience, would hear what he was asking for and shape it, his team would look at it, and they would shape it again.
“What these guys did in four weeks was better than any BI dashboard I’ve ever had in my career.”
Peter Febo
US Head of Asset Management, PHH
That’s the lesson Venn took from it. The interface is the easy part now. The value is in the connected data underneath. Because PHH’s Kairoi data was already in a Company Brain, Venn could build what Peter needed in days instead of the months, or years, these projects usually take.
What PHH’s portfolio dashboard does
The dashboard sits on top of PHH’s Company Brain. It pulls from each operator’s property management system and the tools around it through Venn’s connectors, and shows the whole portfolio in real time.
- The same data from every operator. Every operator’s data is mapped to PHH’s general ledger, so every property reports the same way, whatever system it runs on.
- A view for every role. The same data powers views for analysts, asset managers and executives on the owner side, and for property managers, regionals and VPs on the operator side.
- Ask anything. Plain-English questions get answers in about six seconds, from simple ones like “What’s my occupancy?” to Peter’s favorite: “Tell me the top five properties that have the highest delinquency.”
- Highlights, not just data. An AI layer reviews performance and flags risks and what to do about them.
“Think of it as an army of analysts and asset managers sitting by you.”
Zion Perets
Chief Real Estate Officer, Venn
How PHH’s asset managers use one live view
On pricing calls. PHH sits in on its operators’ pricing calls every couple of weeks; a lot of owners don’t. On a recent one, Peter quoted the property’s lead-to-lease and asked the operator why they weren’t converting and why their Google reviews had gone down. All of it was on his dashboard. “Just having it right there while having the conversation just made the conversation better.”
The weekly roll-up. PHH’s analysts used to spend the hours before the Monday and Friday meetings assembling reports. Now the dashboard has a weekly report tab, and that’s what the team works from.
Marketing. PHH spends $400 to $500 a unit on marketing. Now Peter can trace each marketing source on a live dashboard, see lead-to-lease and who is converting, “so I can eventually reduce my operating expenses.”
Google ratings. PHH requires an action plan from operators rated below 4.0. Peter now sees ratings live, with a highlight reel of reviews and how many reviews haven’t been answered.
Delinquency. Instead of waiting for a report on the 5th, Peter can see delinquency on the 1st, the 2nd or any other day, by property or by region.
Renewals and financials. The renewal reports his team used to build in Excel are on the dashboard. PHH is also starting to stream its financials, instead of waiting two weeks after the close of the month.
Knowing residents. Operators are using resident data to shape each property. As Peter described it: “I have one property in Austin that’s super techy people, so we’re curating our events. Then I have a property in north Austin, which is more families. So we’re figuring out we need more food trucks.” For PHH, that means retention: “If they’re happy, they’re going to pay.”
How to compare and benchmark operators
To benchmark operators fairly, an owner needs two things: its own Company Brain, so every operator’s data lands in one place organized the owner’s way, and a way to see it. Once that’s in place, operators can be compared side by side. “I can benchmark them against all the other operators,” Peter said, “because in my system they all look the same.”
Zion knows the problem from the owner’s side. As a CFO working with multiple property management companies, each with its own reporting, his team spent countless hours assembling the picture so he could make a decision. “That process was super painful, not always accurate, because so many moving pieces,” he said.
It was frustrating for the operators too, who had to meet every owner’s reporting requests. With one shared dashboard, “the property manager now sees what I see,” Zion said, “and so you develop that common language.” A regional manager can answer an owner’s question on the call instead of saying “let me get back to you,” and owner reports come out of the same dashboard automatically.
One of PHH’s operators already runs on Venn day to day, and another started engaging after seeing the dashboard. Fewer reports means more of their time goes to residents and leasing.
“I want the humans doing the job. I want the system doing the reporting.”
Peter Febo
US Head of Asset Management, PHH
What changes for the asset management team
Peter is clear that this isn’t about cutting analysts. “I’m not looking to reduce my analysts. I’m looking for my analysts to become smart.”
His analysts helped audit the data as the system came together. Now that they’re not running spreadsheets, they spend that time on business decisions and visiting the sites.
Peter believes properties still run on people. “No matter how much AI and software comes out, we still need humans,” he said. The time he saves goes back to the properties: more travel, more time on site, and the data at his fingertips to find gaps and fix them faster, “which ultimately should lead to better performance of the properties.”
How to get one view across your operators
If you manage assets across more than one operator, PHH’s path is a good template:
- List every system and login your team uses to see the portfolio, and every report you receive.
- Write down your definitions for the metrics you compare operators on, and your chart of accounts.
- Connect, don’t replace. Put a Company Brain over your operators’ existing systems rather than forcing them onto yours.
- Start with the properties whose data is easiest to reach, then add operators one at a time.
- Have your analysts audit the data against the source systems before anyone relies on it.
- Use it live. Bring the dashboard into pricing calls and operator reviews, not just monthly reporting.
Watch the full session
Peter and Zion spoke with a room of New York asset managers and operators at Venn’s office. Watch the whole conversation, from the nine logins to life after reports.

Peter Febo and Zion Perets at Venn’s New York office (31 minutes)
Frequently Asked Questions
Give the portfolio its own Company Brain: a connected layer that sits on top of the systems each operator already uses and organizes their data the owner’s way, with a live dashboard on top. That replaces collecting and stitching together each operator’s reports. PHH does this across more than 14,000 apartments and four operators.
Map every operator’s data to the owner’s own general ledger and definitions in one place, so each property reports the same way no matter which system it runs on. To see his portfolio, PHH’s Peter Febo used to log into three property management systems and two CRMs; now they all show up the same way in one dashboard.
Venn. It builds the owner’s own Company Brain on top of the systems its operators already use, through Venn’s connectors, with a real-time portfolio dashboard on top, so no operator has to switch software. PHH had a first working dashboard a few days after its first call with Venn, and within 30 days it was configured the way the team works, with the rest of its operators’ systems connected.
They need their own Company Brain, so every operator’s data lands in one place organized the same way, and a way to see it. Then operators can be compared side by side on the same metrics, like lead-to-lease, delinquency, Google ratings and renewals. “I can benchmark them against all the other operators,” says PHH’s Peter Febo, “because in my system they all look the same.”
Work from the same live data instead of trading reports. When the property manager sees what the owner sees, questions get answered on the call instead of days later, and weekly reports come out of the dashboard. As Peter Febo puts it: “I want the humans doing the job. I want the system doing the reporting.”
With a live dashboard over every operator’s data and an AI layer that flags risks. PHH’s team sees delinquency any day of the month, watches Google ratings and unanswered reviews live, and brings lead-to-lease into pricing calls, instead of waiting for weekly and monthly reports.
No. The Company Brain connects to whatever system each operator already uses. The alternative, buying one system and forcing every operator onto it, makes the owner responsible for the data, the training and the outages. PHH ruled that out: “That’s really an operator responsibility.”
Not at PHH. “I’m not looking to reduce my analysts. I’m looking for my analysts to become smart,” says Peter Febo. His analysts helped audit the data, and now spend time they used to spend on spreadsheets on business decisions and site visits.
See what one view across your operators looks like. Talk to our team.
Zion Perets Chief Real Estate Officer
Zion Perets is Venn's Chief Real Estate Officer and spent fifteen years as CFO of an owner-operator before joining. He writes about real estate from the owner's seat: finance, budgeting, and asset performance.
Connect with Zion on LinkedIn